
Factors Afecting Tourist Satisfaction with Traditional Craft Tea Villages in Thai Nguyen Province
30/01/2021JOURNAL OF ECONOMIC AND DEVELOPMENT, NATIONAL ECONOMIC UNIVERSITY, HANOI, VIETNAM; VOL.21; SPECIAL ISSUE; JANUARY 2019, PP. 153-167; ISSN 1859 0020; JEL CODE: C38P
Authors: Vu Quynh Nama, Tran Chi Thienb
aThai Nguyen University of Economics and Business Administration (TUEBA), Vietnam[1]
bThai Nguyen University of Economics and Business Administration (TUEBA), Vietnam
ABSTRACT
Data collected from a survey of 215 visitors in 3 traditional craft tea villages in Thai Nguyen province were analyzed by using multivariate data analysis (test for the reliability of the scales, exploratory factor analysis and multivariate regression analysis) to determine the factors that afect tourist satisfaction with the villages as tourism destinations. The results showed that natural characteristics, infrastructure, service quality, government support, and emotional values are major factors that infuence tourist satisfaction. Based on that, the study proposed some solutions for the local government, tourism enterprises and the local communities to improve tourist satisfaction and develop traditional craft tea village tourism in Thai Nguyen province towards a sustainable manner.
Keywords: Afecting factors, Thai Nguyen province, traditional craft tea villages, tourist satisfaction
1. Introduction
Tourism is one of the world’s fastest-grow-ing sectors. In 2017, travel and tourism sector were predicted to add nearly USD7.9 trillion to the global economy, or 10.2 percent of global gross domestic product (GDP) (World Trav-el and Tourism Council, 2017). In Vietnam, in 2017, the direct contribution of tourism to GDP was estimated to be 6.8%. Direct, indirect and spillover efects of tourism, in total, was estimated to be 14% of GDP (Politburo of the Communist Party of Vietnam, 2017). Tourism development can help to develop many other sectors in the economy such as transportation, construction, traditional crafts, food and bever-age production, etc. and help to conserve natural and cultural heritages and resources, create job opportunities and improve the living standard of people at tourism destinations.
Among many tourism categories, a general consensus has emerged on the role and potential of community-based tourism and craft village tourism in the national as well as provincial tourism development strategies. Community-based tourism at craft villages has been considered a sustainable approach for tourism in which local communities are directly involved in tourism activities.
Thai Nguyen is a province in the Northern Midlands and Mountainous Region of Vietnam. The province is not only well known for its famous tourist spots such as Nui Coc Lake, Phuong Hoang Cave, Dinh Hoa Safety Resistance Zone but also known as the “Tea Capital” of Vietnam with its distinguished tea product quality, attractive, beautiful green tea hills and valleys and many unique cultural features of the traditional craft tea villages. Thai Nguyen traditional craft tea villages are situated in charming landscape regions with kind and hospitable tea farmers. This is a good condition to attract tourists to the tea villages.
Recently, Thai Nguyen province has launched “Program on Developing Culture, Sports and Tourism, Period 2017-2020” which determines “promoting tourism to become a key economic sector of the province” (Thai Nguyen Provincial People’s Committee, 2017). Based on the exploitation of available resources, Thai Nguyen has developed unique types of tourism in the province, developed ecotourism and back-to-the-origin tours associated with traditional craft tea villages as special destinations including: i) The Museum of Ethnic Culture of Vietnam - Tan Cuong Tea Cultural Space (visit Tan Cuong Traditional Craft Tea Village) - Nui Coc Lake (boat trip on Nui Coc Lake); ii) The Museum of Ethnic Culture of Vietnam - La Bang Tea Cultural Space (visit La Bang Traditional Craft Tea Village) - Nui Coc Lake (boat trip on Nui Coc Lake) - Tan Cuong Traditional Craft Tea Village and some other traditional craft tea villages. Therefore, tourism in Thai Nguyen province has brought about remarkable economic and social benefts. To be more successful, the village communities, the tourism enterprises, and the local government organizations must know to what extent the visitors are satisfed with the traditional craft tea villages as tourism destinations, and what are the factors infuencing their satisfaction. By knowing the factors that create tourist satisfaction, they could make appropriate adjustments in their tourism development policies and management, provide powerful marketing programs and investment to enhance the competitiveness of the tourism destinations.
Tourist satisfaction is a major key to the success of the tourism industry because it can create both revenue and proft (Dmitrovic et al., 2009). Unfortunately, only a few academic studies have focused directly on satisfaction among tourists since these studies have faced several difculties on conceptual and practical grounds (Zabkar et al., 2010; Sadeh et al., 2012; Aliman et al., 2016). There are a more limited number of studies that have focused on tourist satisfaction with tourism destinations in Vietnam. Especially, there has been no research so far to study visitors’ satisfaction with the traditional craft tea villages as tourism destinations, to explore factors afecting the satisfaction, and draw out suggestions for the local communities and concerned organizations to further develop the community-based tourism in the traditional craft tea villages. Hence, a study of the factors afecting the satisfaction of the visitors with the villages is really an urgent need.
2. Theoretical background
2.1. Customer satisfaction
Consumer satisfaction can be defned as the individual’s perception of the performance of a product or service in relation to his/her expectation. A consumer whose perceptions match/exceed or fall below his/her expectations will be satisfed/very satisfed or dissatisfed respectively (Khatib & Al-Ali, 2011). Hence, satisfaction of a customer can be measured based on the diference level between expected value and the perceived value of a product/service that the customer consumes at a certain price.
2.2. Tourist satisfaction with tourist destinations
Ugurlu (2010) simply defned “Tourism is a collection of activities, services and industries which deliver a travel experience comprising transportation, accommodation, eating and drinking establishments, retail shops, entertainment businesses and other hospitality services provided for individuals or groups traveling away from home”.
Tourist satisfaction is the extent of tourist fulfllment pleasure that results from the trip experience about a product or service feature that fulflls the tourist’s desires, expectation and wants in association with the trip. Satisfaction is created for the tourist by the comparison of his/her expectations before travel and his/her perceptions or experiences after travel (Severt et al., 2007).
Some studies have focused on the topic of tourist expectations of a travel destination in relation to the tourist’s choice of the destination. These studies assumed that the tourist does not have enough personal experience relating to a tourism destination, therefore he/she makes the decision to visit the site based upon his/her image of this destination rather than its reality (Chon, 1990). The extent to which the tourist is satisfed with the destination depends on how far the tourist’s expectation (or expected value before the travel) difers from his/her real experience when and after the visit to the destination (the perceived value of the tourism destination).
Previous studies have posed arguments but there is no complete universal cause-and-efect model found specifcally for measuring tourist satisfaction with tourism destination (Aliman et al., 2016).
Meng et al. (2011), used the two variables including image and perceived value of the destination, to predict tourist satisfaction.
According to the American Customer Index (ACSI) model, there are three antecedents of the satisfaction of the visitors: customer expectation, perceived quality and perceived value. In the last decade, the model has been widely used in diferent regions (Aliman et al., 2016). Um et al. (2006) when studying Hong Kong tourism applied this model to investigate the impact of customer expectation, perceived quality and perceived value on tourism satisfaction. Wang et al. (2009) when studying antecedents of tourist satisfaction in Guilin (China) revealed that destination image, perceived quality and perceive value are predictors of tourist satisfaction. Dmitrovic et al. (2009) when conceptualizing tourist satisfaction, introduced fve antecedents of customer satisfaction: image, quality, value, and costs and risks.
Adinegara et al. (2017) when reviewing the literature, came up with the conclusion that “there is still a debate on the factors that determine satisfaction in tourism. There are many factors that create satisfaction but in general factors of image, perceived quality and perceived value are ones that are most widely used in the efort to create tourists’ satisfaction”.
Inheriting results from the previous studies, this paper focuses on testing whether or not factors including image, perceived quality and perceived value could be major antecedents of tourists’ satisfaction with the traditional craft tea villages in Thai Nguyen province as tourism destinations with some necessary modifcation.
There are some studies that discuss these antecedents. Nguyen & Leblanc (2001) noted that image is an impression of companies (in our case, of a tourist destination) that has been embedded in the minds of consumers from their advertising and public relations, from word of mouth, and through the consumer’s experience when consuming goods and services ofered. Mossberg & Kleppe (2005) emphasized that building an image of a tourist destination is important since it can serve as a patronage in diferent geographical units, tourist attractions, and various providers of tourism infrastructure. It implies that natural characteristics and infrastructure could be the two important aspects of the image of a tourist destination.
Chen & Tsai (2007) and Aliman et al. (2016) defned perceived quality as the visitor’s assessment of the standard of the service delivery process in association with the trip experience. In Thai Nguyen province, beside services provided by travel companies, on-site enterprises, and local communities, the local government also provides some services (supports) to the tourism destination including public administration services, local regulations and public security and order. Hence, the perceived quality factor in this case could be studied in the form of two separate elements that are service quality (for services provided by organizations, individuals) and government supports.
Perceived value, according to Woodruf 1997), is the customer’s preference, perception and appreciation of a product/service characteristics, performance, and results (or consequences) from using the product/service. De Ruyter et al. (1997) introduced a comprehensive value-based approach, in which monetary value is incorporated with emotional value. According to them, perceived value for the customers could be measured by emotional value, practical value and logical value. Emotional value presents the consumer’s assessment of the feelings associated with services (happy or unhappy) while the practical value presents the reality aspect of the service and the logical value represents the relationships between service quality and their prices. Out of the three categories of value, emotional value can be considered the center.
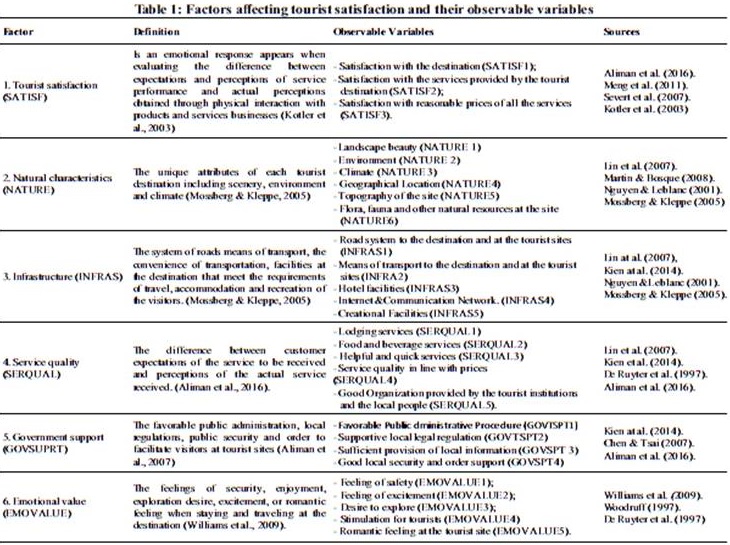
Hence, in this research, factors afecting tourist satisfaction with the traditional craft tea villages are assumed to include: (1) natural characteristics, (2) infrastructure, (3) service quality, (4) government supports, and (5) emotional value.
Each factor could be measured by using their observable variables listed in Table 1.
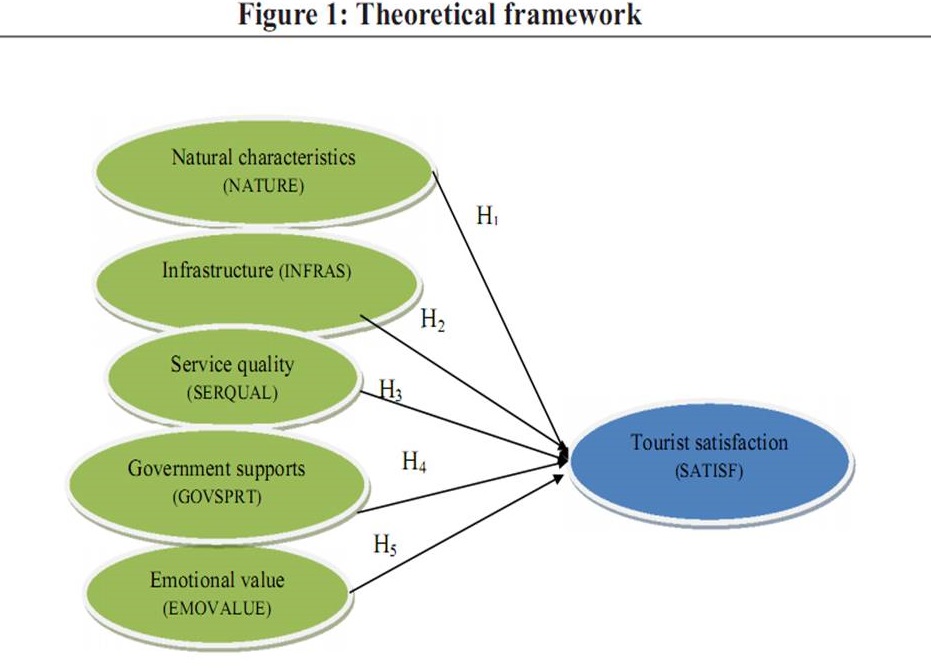
Hypotheses:
Hypothesis 1: Natural characteristics afect tourist satisfaction positively;
Hypothesis 3: Tourism infrastructure afects tourist satisfaction positively;
Hypothesis 3: Service quality afects tourist satisfaction positively;
Hypothesis 4: Governmental supports afect tourist satisfaction positively;
Hypothesis 5: Emotional value afects tourist satisfaction positively.
3. Research methods
3.1. Study sites
Currently, the traditional craft tea village tourism is being implemented in some typical communes in three special tea regions of the province such as Tan Cuong and Phuc Xuan communes (in the special tea area of the city Thai Nguyen); Song Cau township, Vo Tranh commune and Tuc Tranh commune (belonging to tea area of Dong Hy district and Phu Luong district); La Bang and Hung Son townships (belonging to the specialty tea area of Dai Tu district). Three traditional craft tea villages were selected for the study including the traditional craft tea village of Hong Thai 2 (Tan Cuong commune, Thai Nguyen city), the traditional craft tea village of Hamlet 5, Song Cau township (Dong Hy district), La Bang traditional craft tea village (La Bang commune, Dai Tu district).
3.2. Data survey
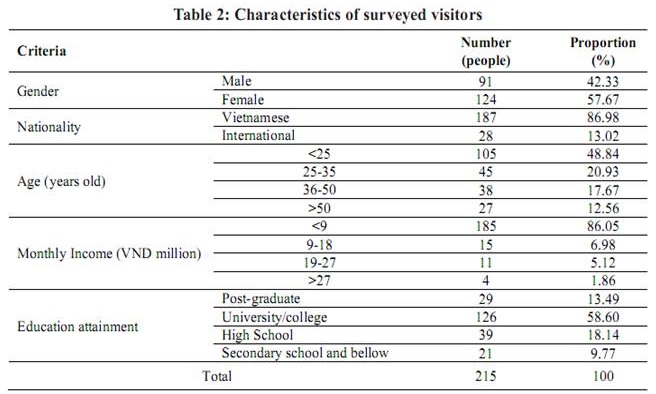
Surveyed subject: Domestic and international tourists traveling in 3 selected villages (Hong Thai 2, Hamlet 5, La Bang) were randomly selected.
Sample size: There were 300 questionnaires distributed to the visitors who were visiting the three traditional craft tea villages (100 questionnaires in each village). After checking them, 215 questionnaires were found valid and have been used for processing. According to Hair, et al. (2006), for the use of the Exploratory Factor Analysis method, the observable/measurable variables ratio should be at least 5/1. In this study, the number of observable variables is 26; hence, the minimum required sample size is 130. The 215 samples used for the study are much more than the requirement and that defnitely ensures a high reliability.
Questionnaire: The content of the questions in the questionnaire aimed to gather visitors’ opinions about their characteristics and their opinions on the observable variables. Their answers were coded by the Likert scale of 5 points (1: Strongly disagreed, 2: Disagreed, 3: Neutral, 4: Agreed and 5: Strongly Agreed). The questionnaire was translated from Vietnamese into English for use by international visitors.
Survey time: The survey was conducted during April and May 2018.
3.3. Data analysis methods
The analysis of the factors afecting the satisfaction of visitors in traditional craft tea villages in Thai Nguyen province has been conducted in three steps:
3.3.1. Test for the reliability of the scales (factors)
Checking the quality of the observable variable: If an observable variable has Corrected Item-Total Correlation ≥ 0.3, this observable variable ensures a good quality (Nunnally & Bernstein, 1994);
Checking the quality of the scales (each factor): If the Cronbach’s Alpha coefcient of each scale is ≥ 0.6, the scale has acceptable quality for reliability (Hair et al., 2006).
3.3.2. Explanatory factor analysis (EFA)
Checking EFA method conformity: if: 0.5
Verifying that the observable variables are correlated in a scale: if Barlett’s Test is statistically signifcant (Sig. ≤ 0.05), observable variables are correlated with one another in a scale;
Checking the explanation possibility of observable variables: if Total Variance Explained ≥ 50%, at least 50% of a change in the representative factors explained by the observable variables (Hair et al., 2006);
Checking the summary capacity of a factor: if the Eigenvalue (representing the variance explained by each factor)> 1, it is the factor that generates the best summary of the information from its observable variables.
3.3.3. Regression analysis
To test for the suitability of the regression model, F-test is employed: regression function is statistically signifcant at 0.05 if F – statistic has Sig. ≤ 0.05;
To test for the statistical signifcance of each unstandardized regression coefcient, T-test is employed: if the t-statistic has Sig. ≤0.05, the efect of the independent variable on the dependent variable is statistically signifcant at 0.05.
4. Research results
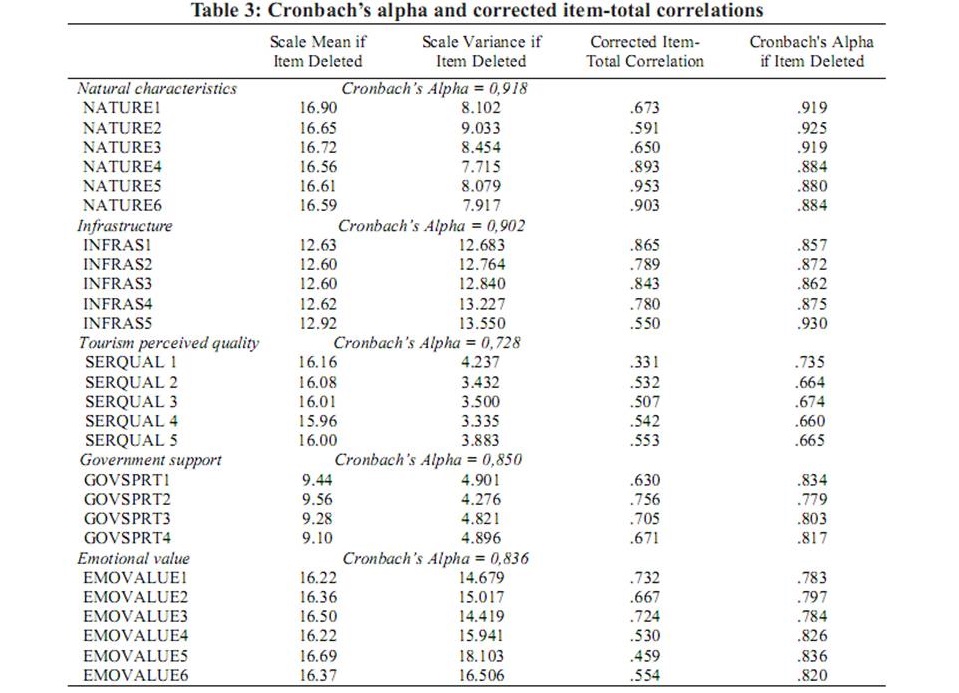
4.1. Test for the reliability of the scales (factors)
As seen in Table 3, all the Corrected Item-Total Correlation coefcients of the observable variables are > 0.3, so 26 observable variables are of good quality. On the other hand, all the factors (scales) have Cronbach’s Alpha > 0.6, so all factors meet the quality requirements or reliability requirements for inclusion in the EFA analysis.
4.2. Exploratory factor analysis
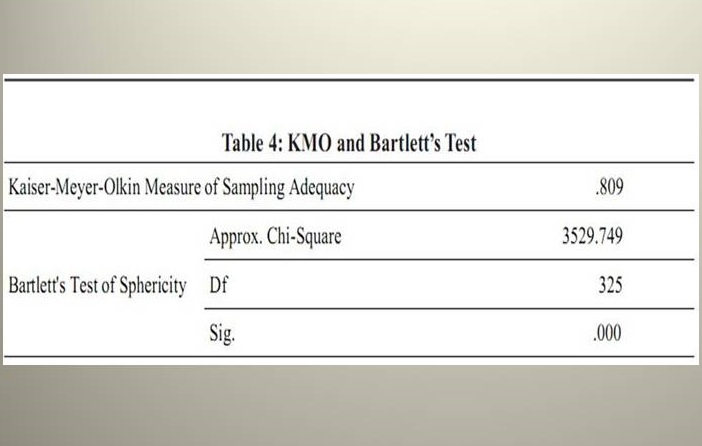
4.2.1. Test for the conformity of EFA
As shown in Table 4, since KMO is 0.809 > 0.5, the EFA is appropriate with the data set. Barlett’s test has df =253 with statistical signifcance level=0.000<0.05, so the observable variables have a linear correlation to the representative factors. Therefore, data is appropriate for EFA.
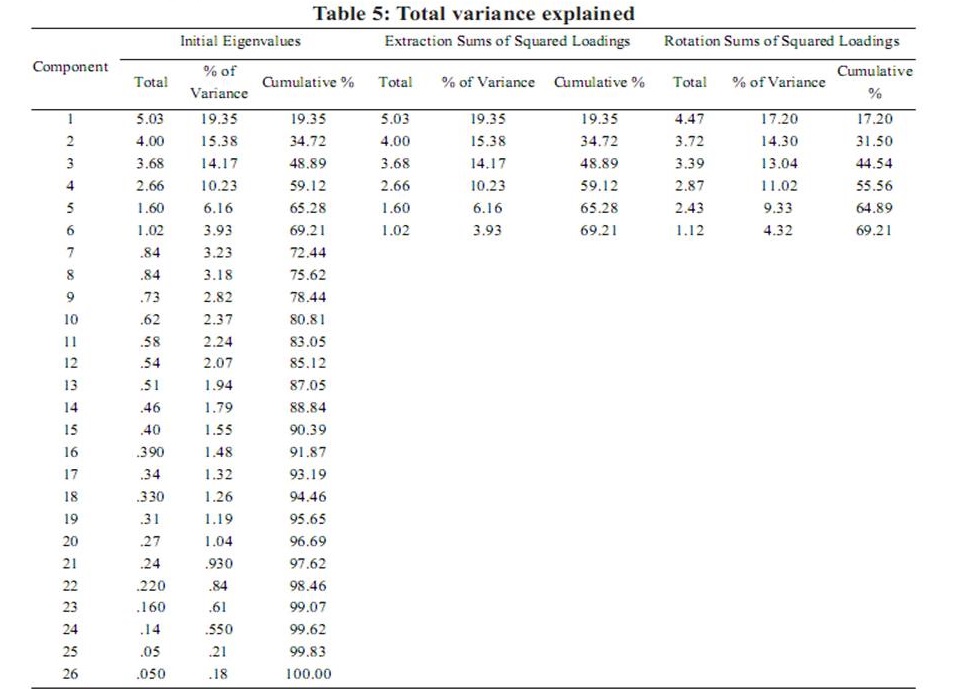
4.2.2. Test for the explanation degree of observable variables to the variation of the factors
As seen in Table 5, the cumulative variance value is 69,21(%) in the Cumulative columns. This means that 69,21% of the change in these six factors is explained by their observable variables. The eigenvalues of every factor is> 1 confrming that these factors are very good summaries of their observable variables.
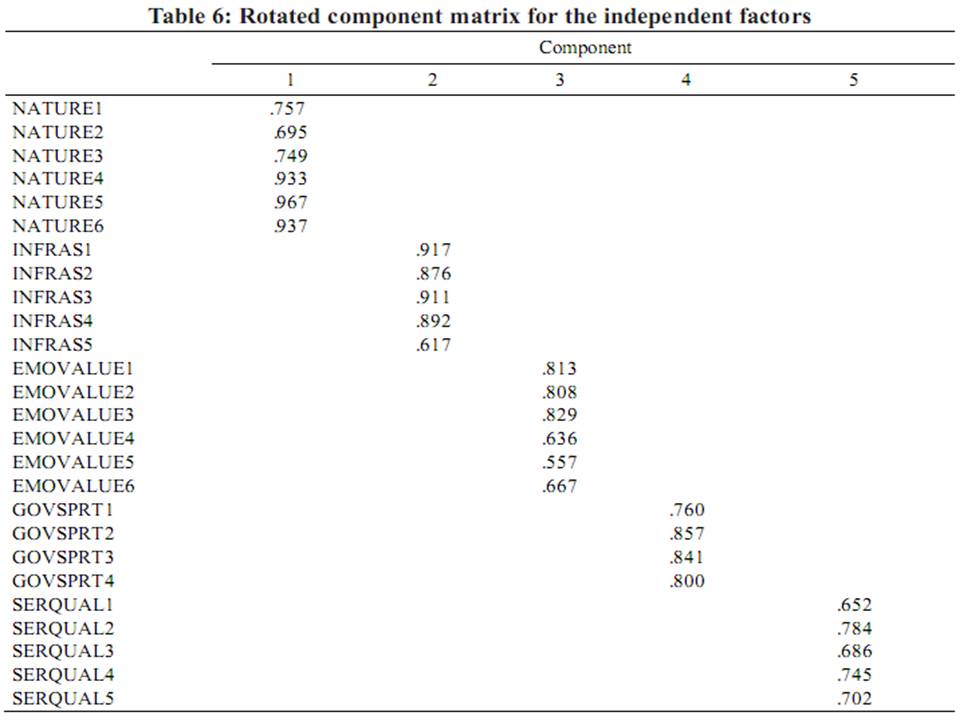
Results of EFA
In Table 6, the observable variables have a Factor Loading ≥ 0.557> 0.5 showing that the correlation coefcient between each observable variable and each representative factor is relatively close to tight. Thus, the fve factors representing the observable variables are the independent variables that afect tourist satisfaction (dependent variable).
The results of factor analysis for tourist satisfaction show that: Factor loadings of all
observable variables ≥ 0.797> 0.5 imply that the correlation coefcient between each observable variable and its representative factors (tourist satisfaction) is at a tight level. Thus, the factor of tourist satisfaction, that represents the observable variables, is a good dependent variable.
4.3. Regression analysis
The dependent variable is “Tourist satisfaction” (SATISF); 05 independent variables include: “Natural Characteristics” (NATURE); “Infrastructure” (INFRAS); “Service quality” (SERQUAL); “Government Support” (GOVSPRT); and “Emotional Value” (EMOVALUE).
Running regression gives the results presented in Tables 8, 9, and 10.
In Table 9, F = 87.48 with Sig. = 0.000, the regression model is statistically signifcant at 0.000.
Tests for multi-collinearity, autocorrelation, and heteroscedasticity were satisfed, indicating that the regression model does not violate the OLS assumptions.
Table 10 shows that all unstandardized regression coefcients of the fve independent variables have Sig. = 0.00 <0.05 which implies that the fve variables included in the model are statistically signifcant in relation to the dependent variable.
Table 7: Rotated component matrix for the dependent factor (tourist satisfaction)
|
Observable Variable |
Factor Loading |
|
SATISF1 SATISF2 SATISF3 |
.847 .856 .797 |
Table 8: Regression model summary
|
R |
R Square |
Adjusted R Square |
Std. Error of the Estimate |
|
.823 |
.677 |
.669 |
.57538285 |
Table 9: ANOVA
|
|
Sum of Squares |
df |
Mean Square |
F |
Sig. |
|
Regression |
144.807 |
5 |
28.961 |
87.480 |
.000 |
|
Residual |
69.193 |
209 |
.331 |
|
|
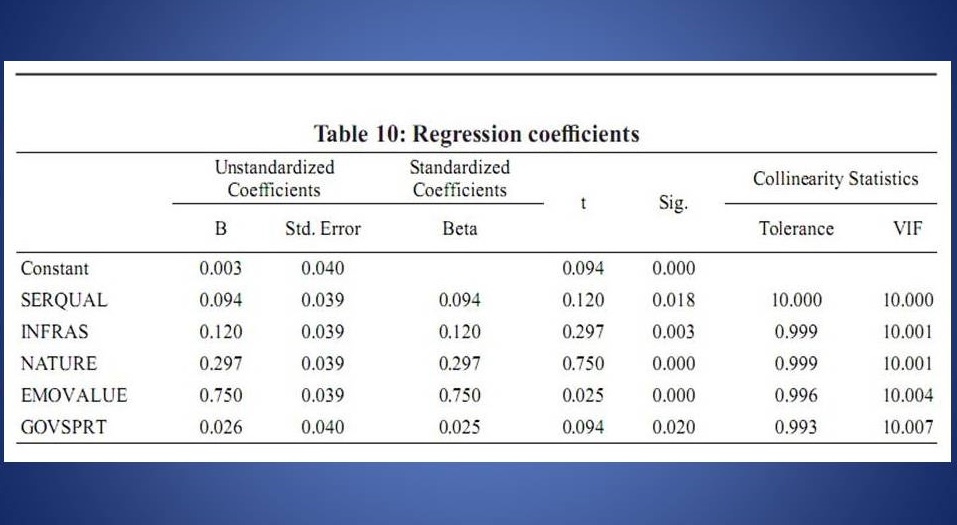
As seen in Table 7, the Adjusted R-square is 0.669. This means that the model explains 66.9% the variation in tourist satisfaction with fve statistically signifcant independent variables, namely, infrastructure (INFRAS); natural characteristics (NATURE); emotional value (EMOVALUE); and government support (GOVSPRT). Using unstandardized regression coefcients (B), the following regression equation is obtained:
ATISF = 0.03 + 0.094SERQUAL + 0.120IN-FRAS + 0.297NATURE + 0.750EMOVALUE + 0.26GOVSPRT
All the unstandardized regression coefcients are positive, so these independent variables are all positively correlated with the dependent variable. This means that all the hypotheses are satisfed. The magnitude of each unstandardized regression coefcient shows the specifc efect of the respective independent factor on the change in tourist satisfaction. For instance, when emotional value increases by one point, tourist satisfaction will increase by 0.750 points.
Besides, the standardized coefcients (Beta) show that factors afecting the satisfaction of tourists in the traditional craft tea villages of Thai Nguyen province by the degree of impact from stronger to weaker are: emotional value, natural characteristics, infrastructure, service quality, and government supports. In particular, the factor of emotional value has the strongest impact on the satisfaction of visitors to the traditional craft tea villages of Thai Nguyen province. This can be explained in that tourist satisfaction depends on the interests of tourists the most: enjoying the experience, a desire to explore, enjoying the romantic scenery, and so on. Meanwhile, most tourists coming to traditional craft tea villages are self-organized tourists; and there are no tourism management agencies for traditional craft tea villages. Thus, the role of local government support has not been appreciated and has not had much efect on tourist satisfaction.
5. Conclusion and recommendations
5.1. Conclusion
There are 05 factors that afect the satisfaction of tourists in the traditional tea villages in Thai Nguyen province, ranked by the impact level as follows: emotional value; natural features; the infrastructure; service quality and government support.
5.2. Recommendations
To develop tourism in traditional craft tea villages, the following recommendations have been proposed:
5.2.1. For the local governments
Firstly, the Provincial People’s Committee should have a policy of close coordination between the relevant departments and agencies in organizing the development of tourism villages. Specifcally, coordination between the Association of Craft Villages with the Department of Culture, Sports and Tourism with the authorities of districts, communes and the traditional craft tea villages, from which the policies of the province are implemented synchronously and efectively.
Secondly, the attractiveness of the destination and the accessibility to the villages should be further improved through the enhancement of information and communication services, and signs to craft villages should be erected.
Thirdly, it is necessary to build a local tourism trademark based on the perception of visitors to the traditional craft tea village.
Fourthly, in order to develop the tourism of traditional craft tea villages, to promote the cultural values of craft villages, local authorities should attract investment capital sources for tea village tourism for construction of transportation systems and to propagate and encourage everyone, every family and every organization to preserve the landscape and environment in the traditional craft tea villages.
Fifthly, the Provincial People’s Committee should have policies to train human resources for tourist activities in traditional craft tea villages on foreign language skills, tourism marketing skills and hotel and restaurant services.
5.2.2. For tourism enterprises
Firstly, tourism enterprises need to organize tours with destinations such as tea villages and Tea Cultural Spaces.
Secondly, tourism enterprises need to focus on improving their perceived quality by improving the level of tour guides to the traditional craft tea villages to guide visitors to enjoy the beauty of the tea area, cultural tea space, the cultural beauty in tea production, processing and preservation and the beauty in the art of tea drinking to afect the emotions of visitors.
Thirdly, to upgrade the perceived quality of tourism for tourists: passenger transportation facilities, living facilities during moving in and out and during staying in the traditional craft tea villages.
5.2.3. For the local communities in the traditional craft tea villages
Firstly, a Tourism Management Board should be set up in each traditional craft tea village where it has not already been established. The Board will act as the host to coordinate the cooperation of all related stakeholders.
Secondly, it is necessary to raise the awareness of people in traditional craft tea villages about the role of tourism in the socio-economic development of the locality in general and of the tea households in particular. From there, change the perception and thinking of the people to promote the tradition of hospitality and friendliness between the local people and the tourists.
Thirdly, raising awareness of the traditional craft tea villagers about the environmental sanitation of the village to ensure a clean environment is also needed to meet the demand for food, travel and the experience of the visitors.
REFERENCES
Adinegara, G.N.J., Suprapti N.W.S., Yasa, N.N.K. & Sukaatmaja, I.P.G. (2017), ‘Antecedents and Consequences of Tourist Satisfaction: A literature Review’, ASEAN Marketing Journal, IX(1), 40-53.
Aliman, N.K., Hashim, S.M., Wahid, S.D. & Harudin, S. (2016), ‘Tourists’ Satisfaction with a Destination: An Investigation on Visitors to Langkawi Island’, International Journal of Marketing Studies, 8(3), 173-188.
Chen, C.F. & Tsai, D. (2007), ‘How destination image and valuation factors afect behavioral intentions’, Tourism Management, 28, 1115-1122.
Chon, K.S. (1990), ‘The role of destination image in tourism: a review and discussion’, The Tourist Review, 45(2), 2-9.
Dao Trung Kien, Tran Manh Toan, Bui Quang Tuyen, Nguyen Van Duy & Nguyen Thi Lien (2014), ‘The impact of local attributes on the satisfaction of investment enterprises: Evidence from Hai Duong’, Journal of Economics and Development, 210 (1), 43-52.
De Ruyter, K., Wetzels, M. & Bloemer, J. (1997), ‘The dynamics of the service delivery process: a value-based approach’, International Journal of Research in Marketing,14(3), 231-243.
Dmitrovic T., Cvelbar, L. Kolah, T., Brencici, M., Ograjensek, I. & Zabkar, V. (2009), ‘Conceptualizing tourist satisfaction at the destination level’, International Journal of Culture, Tourism and Hospitality Research, 3(2), 116-126.
Hair, J., Black, W., Babin, B., Anderson, R. & Tatham, R. (2006), Multivariate Data Analysis, 6th Edition, Pearson Prentice Hall, Upper Saddle River, NJ.
Khatib, F.S., and Al-Ali R.O. (2011), ‘Factors afecting tourists satisfaction of Jordan as a tourism destination’, Studies in Business and Economics, 16(1), 19-38.
Kotler, P. (2001), Marketing Management, Millennium Edition, Prentice Hall, Upper Saddle River, NJ. Lin, C.H., Morais, D., Kerstetter, D. & Hou, J.S. (2007), ‘Examining the role of cognitive and afective image in predicting choice across natural, developed and theme-park destinations’, Journal of Travel Research, 46, 183-194.
Martin, H.S. & Del Bosque, I.A. (2008), ‘Exploring the cognitive – afective nature of destination image and the role of psychological factors in its formation’, Tourism Management, 29(2), 263-277.
Meng, Shiang-Min, Liang, Gin-Shuh & Yang, Shi-Hao (2011), ‘Relationship of cruise image, perceived value, satisfaction, and Post-purchase behavioral intention on Taiwan tourists’, African Journal of Business Management, 5(1), 19-29.
Mossberg, L. & Kleppe, I. (2005), ‘Country and destination image: Diferent or similar image concepts’, The Service Industries Journal, 25(4), 493-503.
Nguyen, N. & Leblanc, G. (2011), ‘Corporate image and corporate reputation in customers, retention decisions in services’, Journal of Retailing and Customer Services, 8(4), 277-236.
Nunnally, J.C. & Bernstein, I.H. (1994), ‘The assessment of reliability’, Psychometric Theory, 3rd edition, McGraw Hill, New York, 248-292.
Phan Minh Duc & Le Tan Buu (2017), ‘The impact of destination image, emotional value on the satisfaction and the loyalty of visitors to Da Lat city’, Journal of Economics and Development, 236 (2), 82-91.
Politburo of the Communist Party of Vietnam (2017), Resolution No. 08-NQ/TW, on developing tourism into a spearhead economic sector, promulgated on January 16th, 2017.
Sadeh, E., Asgari, F., Mousavi, L. & Sadeh, S. (2012), ‘Factor afecting tourist satisfaction and its consequences’, Journal of Basis and Applied Scientifc Research, 2(2), 1557-2012.
Severt, D., Wang, Y., Chen, P. & Breiter, D. (2007), ‘Examining the motivation, perceived performance and behavioral intentions of conventional attendees: Evidence from a regional conference’, Tourism Management, 28(2), 399-408.
Thai Nguyen Provincial People’s Committee (2017), ‘Thai Nguyen Provincial Culture, Sports and Tourism Program in the period of 2017-2020’, issued on June 26, 2017 under Decision No. 1570 / QD-UBND of the Provincial People’s Committee Thai Nguyen.
Ugurlu, T. (2010), Defnition of tourism: UNWTO defnition of tourism-what is tourism, retrieved on June 3rd 2018, from tourism-what-is-tourism>.
Um, S., Chon, K. & Ro, Y. (2006), ‘Antecedents of revisit intention’, Annals of Tourism Research, 33(4), 1141-1158.
Wang, X., Zhang, J., Gu, C. & Zhen, F. (2009), ‘Examining antecedents and consequences of tourist satisfaction: a structural modeling approach’, Tsinghua Science and Technology, 14(3), 397-406.
Williams, P. & Soutar, G.M (2009), ‘Value, satisfaction and behavioral intentions in an adventure tourism context’, Annals of Tourism Research, 36(3), 413-438.
Woodruf, R.B. (1997), ‘Customer value: the next source of competitive advantage’, Journal of the Academy of Marketing Science, 25(22), 139-153.
World Travel and Tourism Council (2017), Coping with success managing overcrowding in tourism destinations. Executive Summary retrieved on June 16th, 2018, from .
Zabkar, V., Brencic, M. & Dmitrovic, T. (2010), ‘Modeling perceive quality, visitors’ satisfaction and behavioral intensions at the destination level’, Tourism Management, 31(4), 537-546.
Chú thích: [1]Tác giả Vu Quynh Nam (Vũ Quỳnh Nam) hiện đang công tác tại Viện Nghiên cứu Kinh tế & Phát triển Nguồn nhân lực thuộc Trường ĐH Kinh tế & QTKD, ĐHTN.


BÀI VIẾT LIÊN QUAN
+ Water for forests to restore environmental services and alleviate poverty in Vietnam: A farm modeling approach to analyze alternative PES programs
+ Can more irrigation help in restoring environmental services provided by upper catchments? A case study in the Northern Mountains of Vietnam
+ Modeling for the Mountainous Areas of Northern Vietnam - Linear Programming applied to Farming Households
+ Thành tựu cải cách và phát triển kinh tế của Trung Quốc